The research project commenced after three of us, who have since completed the Culham St Gabriel’s leadership programme, were offered the opportunity to create and deliver lessons using the online religious data resource; British Religion in Numbers (BRIN). www.brin.ac.uk
This project was cross-phased, we are a group combined of two Primary practitioners and one secondary practitioner. Nadia Nadeem and Debbie Yeomans are both primary practitioners with year 6 classes. Nadia teaches in Barking and Dagenham, East London, an ethnically diverse community. Debbie teaches in Stoke Golding in a small Church of England village school, serving predominantly a white middle class community. Claire Ramalli teaches RE in a large non-denominational secondary school in the coastal town of Eastbourne, East Sussex. The project involved planning and delivering lessons on two sets of religious data. Firstly, lessons linked to the decolonisation of teaching about Jesus. https://www.reonline.org.uk/research/research-of-the-month/an-approach-to-decolonising-teaching-about-jesus-in-primary-schools/
Secondly, Islamophobia and the misrepresentation of Islam and Muslims in the media. (Discussion on the latter research is found at https://vimeo.com/767284160 .)
We were each eager to deliver lessons that would challenge and question stereotypes, better preparing students for modern day Britain.
We met online to discuss and plan our lessons. We analysed the religious data and aimed to deliver similar style lessons to ensure our research could be replicated. The depiction of Jesus lesson was delivered to the two year 6 classes and a year 7 group. We all introduced our lessons by setting our classrooms up in the style of a gallery, pinning up different depictions of Jesus. Pupils walked around the classroom, guided to discuss each picture, considering questions about the representation of Jesus.

Example questions to support this activity included:
- Which image do you relate to the most and why?
- Which image do you think is most realistic, why did you pick this one?
- Do you think anything has influenced your thoughts?
- Which picture do you think is most historically accurate and why?
- Where do you predict the artwork is from?
- What do you think the artist is trying to convey?
- What else strikes you about the image?
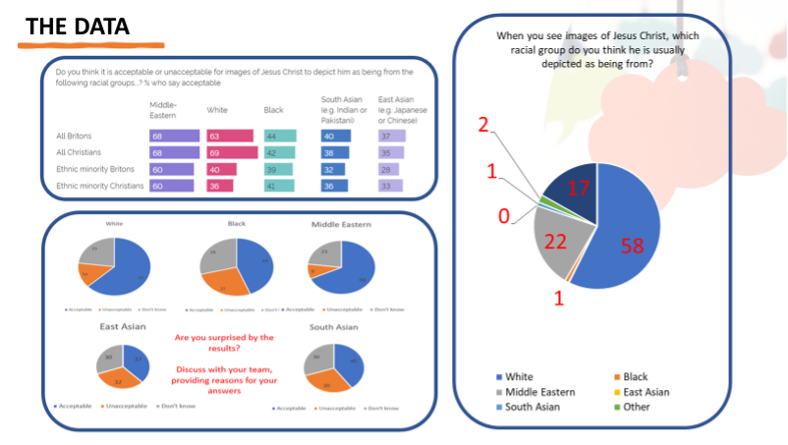
Pupils were then introduced to the YouGov poll data. The data illustrated the majority of people in the UK expect to see a white Jesus. (58%) Debbie incorporated a small group silent discussion in to one of her lessons to deepen the students’ engagement with the data.
Below are examples of questions to support these discussions:
• Why do you think British people are much more likely to see Jesus depicted as White than Middle Eastern?
• Why is there a big difference between the Jesus most British people would expect to see and the depiction of Jesus that makes most sense to them?
• Why do you think younger people are less accepting of the idea of a White Jesus?
What were the key findings?
Nadia’s year 6 class discussed and debated the statistics through a process of inference and critical thinking, using prior learning to support their claims. For example, a pupil reasoned that Jesus must have been tanned as he was born in Bethlehem and that is near the equator, therefore would have had a lot of sun. Another child added that Jesus cannot be blond and blue eyed because he was a Jew, Jews were killed in WW2 for not being blond and blue eyed.
When questioned have you never seen a blond blue eyed Jesus, all the children said ‘no’. This was very much a contrast to Nadia’s own experience and the experience of Claire’s children, who study in a different borough and have seen images of Jesus where he is depicted as a blond blue eyed man.
Nadia’s class were extremely confident with their opinions and conclusions regarding the data and the depiction of Jesus that they believed to be the most accurate. Nonetheless, when posed with the question, “Can Jesus be portrayed as a different ethnicity to enable people to connect with him?” – they all said “Yes, but that would be their opinion and not a fact.”
Debbie’s lessons led to some deep discussions, giving children the chance to consider not only others’ opinions on the depiction of Jesus but also their own ideas. They considered where the Bible suggests Jesus was born and grew up, which led to some powerful lightbulb moments. The children then became quite concerned that the image they were used to seeing of Jesus were not accurate representations, and led to conversations around the depictions of angels particularly at Christmas. Debbie aimed to follow this up at Christmas using Justine Ball’s work on the decolonisation of teaching about Jesus.
Claire’s year 7 class reflected on what they had learnt and if their opinions of the depiction of Jesus had changed since the start of the lesson. Analysing the feedback forms, the majority of students stated that their opinions of Jesus hadn’t changed, a significant number of students had already perceived Jesus to be Middle Eastern based on their prior knowledge of Jesus being Jewish and from Israel. The majority of students believed people’s attitudes towards the depiction of Jesus’ race was mostly based on an individual’s own ethnicity, whilst some students reflected that a persons’ family or stories and pictures of Jesus were the most influential in how a person perceived Jesus to look. One student commented that some Christians might want Jesus to look like them because of the act of the eucharist, with reference to transubstantiation.
What feedback did we get at RExChange?* What might be useful to do next, as a follow-up?
Lessons were taught as stand alone and we all agreed that the subject matter and data should be taught over two lessons rather than the one. All of us said we will incorporate the lessons in to our curricula. Debbie’s class went on to consider whether the data was reflective of their own community. The children made surveys using the data questions and shared them with staff and adults from home. This led to interesting discussions at home and with children’s families. Debbie’s mathematicians enjoyed collecting the data, presenting it to the class to making comparisons. This is something that we all agreed was a worthwhile activity and would deepen further engagement with the data.
Since delivering our research in the RExChange session we have received the following feedback from attendees:
“I did the lessons and would like to do them again, by incorporating them into my curriculum.”
“This was extremely interesting and opened up an exploration between images and data that I hadn’t even considered before! Great stuff.”